Logging Capabilities
Author: Adrian Edwards
Posted on:
Experiment 4
Hypothesis: Is the data that comes out of the erg usable for the purposes of this project?
Procedure: using some fixed-up examples from my fork of Py3Row, connect a USB cable to the erg and see what data these two scripts provide.
Test 1: run the statsshow.py file while connected to an erg and start a workout.
Result 1: it seems to show a feed (not sure if its actually live or not) of the various states (erg state, stroke state, etc) as they change.
Future Improvements: having access to this info is interesting, but not immediately useful. may want to check the docs to see if its possible to add an event/subscription-based “state changed” alert system to Py3Row so that the erg can tell the code once something changes, rather than constantly polling it.
Test 2: run the strokelog.py file while connected to an erg and start a workout.
Result 2: it seems to be saving the data for each stroke in memory and writing to a file at the end, but otherwise, it looks like there is a decent amount of usable data. See workout.csv for the raw data and workout.ods for the data with a the first two strokes graphed. Upon further thinking it seems as though this is to overcome the 16-datapoint limit on the data that can be in each response from the erg. so by requesting data multiple times thoughout the stroke, the full force graph can be compiled and then returned
Future Improvements:
- unfortunately, I did not think to capture photo/video of the force curves on the monitor for comparison
- may want to modify this python file so it acts similarly to how some of the ErgPlot scripts work in where the data is periodically flushed to disk.
Part A
This was another test to see if it was possible to live plot the data (in this experiment it was just pace data) during a workout while rewriting my own scripts to be more extensible, yet still following the idea of the two python scripts from the first trials.
Results: The raw data is in 4adata.csv. here’s a picture as saved from the python ploting library:

Observations:
- seems like its not possible to be both liveplotting and collecting the data in the same pythn program/thread, so they should probably stay as two files
Part B
After a little more script cleanup and some error checking, this experiment was mostly just more of the same (data collection) from Part A using the same simple API. The only notable difference being that I left the script running during an actual workout piece. Surprisingly, I was able to also connect my phone to the erg via bluetooth during this piece (while being connected via USB) so I also have the data saved from Concept2’s official app.
Data/Results:
- The data as captured from the python scripts for the 10k piece
- The concept2 data from the piece (CSV, FIT, TCX)
- a Screenshot of the ergData app after the last stroke of the piece showing peak and average force, stroke count, and drag factor
Observations and Analysis:
- this is probably documented somewhere that I havent bothered to read, but from doing the 10k with the liveplot up, it seems to me like the pace units comong from the erg (i.e. in the CSV files) are in seconds per 1000m
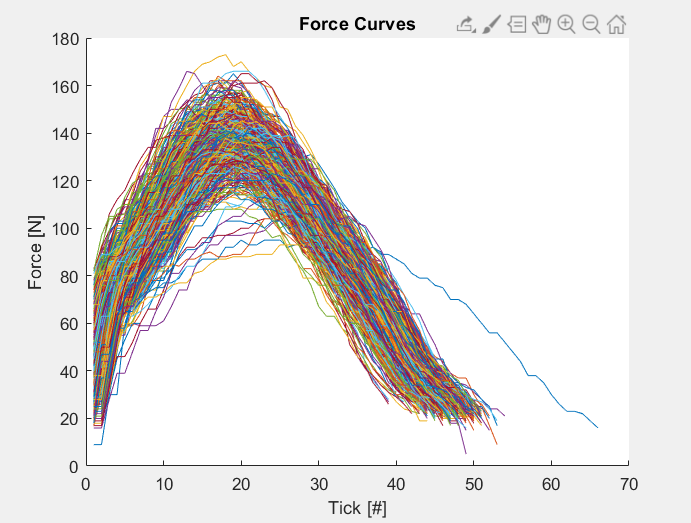
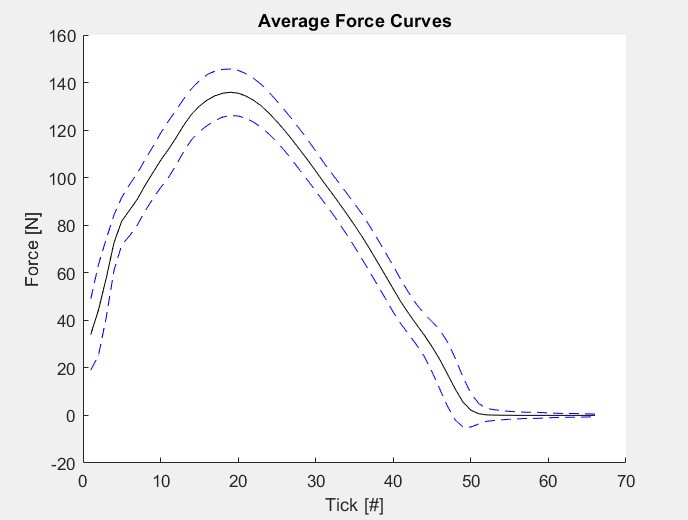
Ben has also created some interesting plots of the data from this 10K using MATLAB
One is an overlay of all the force curves from all the strokes taken during the piece:

The other is a plot of the force curve of an average stroke with 1 standard deviation marked out above and below it:

As you might be able to tell from that one random blue force line in the first plot, i wasnt exactly shooting for consistency for this 10k because, if im being honest, my attention span is nowhere near that long. If I had to guess, I’d say thats probably a stroke I took with one hand while taking a sip of water before getting back into it.
Future Improvements:
- can the units of pace be changed by changing the units on the erg monitor? (doubt it, i presume theyre all just calculated from the per-500 pace)
Additional Findings
- units of other stuff
- From Concept2’s documentation thats apparrently accessible through their SDK, it seems as though the units are all documented:
- drag factor (at least on the PM3???) has units of
N-M-(Sec)^2updating twice per stroke (page 9) - Pace is seconds per kilometer (page 8)
- “Stroke Statistics” seem to be additional numbers not accessible through the simple API and include the following data/accuracy/units (page 12)
- Stroke Distance (0.01m)
- Stroke Drive Time (0.01sec)
- Stroke Recovery Time (0.01 sec)
- Stroke Length (0.01m)
- Stroke Count
- Stroke Peak Force (0.01N)
- Stroke Impulse Force (0.01kg m/s)
- Stroke Average Force (0.01N)
- Work Per Stroke (J)
- while searching the PDF for “RPM” only yielded one result (on page 13), it’s definitely an interesting one. According to the notes in the PDF
At 2000 rpm of flywheel (2000 rpm/60 seconds/m x 3 tics/revolution x 1/12.93 tics/meter = 7.7 meters/second)
this may not beas good as having direct access to RPM data, but having a formula to relate RPM, “tics” (presumably the data coming from the sensor cable???) and meters is super interesting
